“All models are wrong, but some of them are useful”, said George Box, a British statistician, almost 50 years ago. In reality, many agricultural operations rely on the results of various models — from the weather forecast to yield prediction.
Setting up right yield goals and forecasting yield during the growing season is the Holy Grail of precision agriculture. Both USDA and Statistics Canada, as well as some private companies, forecast grain yield during the growing period at the country scale, using remote sensing data, and they do it quite accurately. At the same time, yield forecast at the field or site-specific level has always been a challenge; the results of such forecast can be strongly affected by the influence of crop varieties, soil moisture and fertility levels, and many other factors. Using the same grain yield forecast algorithms for site-specific yield prediction can easily result in 30 to 50 per cent error. Therefore, to achieve better accuracy, yield forecast at the field or management zone level requires additional ground truthing information.
A vegetation index map, e.g. Normalized Difference Vegetation Index (NDVI), at the peak of the growing season, in most cases, is strongly correlated with the grain yield. Previously, we have shared the results of such forecast, using high-resolution drone imagery and field scouting. However, to convert NDVI values into the grain yield information, we need the results of ground truthing. The best criterion of the site-specific yield forecast is to compare predicted results with the actual yield map collected by a calibrated yield monitoring system.
To forecast grain yield in spring wheat, we used a multispectral satellite image from Sentinel 2A collected on July 25, 2021. An NDVI dataset was created from that satellite image and clipped to the field boundary (Smart Farm, Field 18).
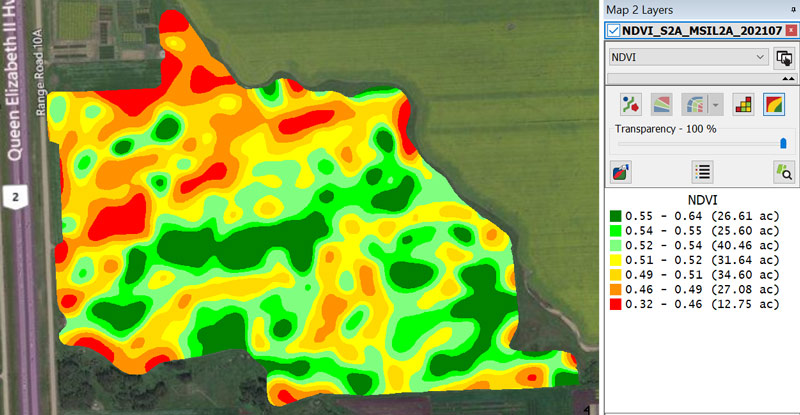
Fig. 1. NDVI map, July 25, 2021. Olds College Smart Farm, Field 18.
To forecast grain yield, our Digital Ag team used this NDVI map for navigation in the field and collection of the ground truthing data.
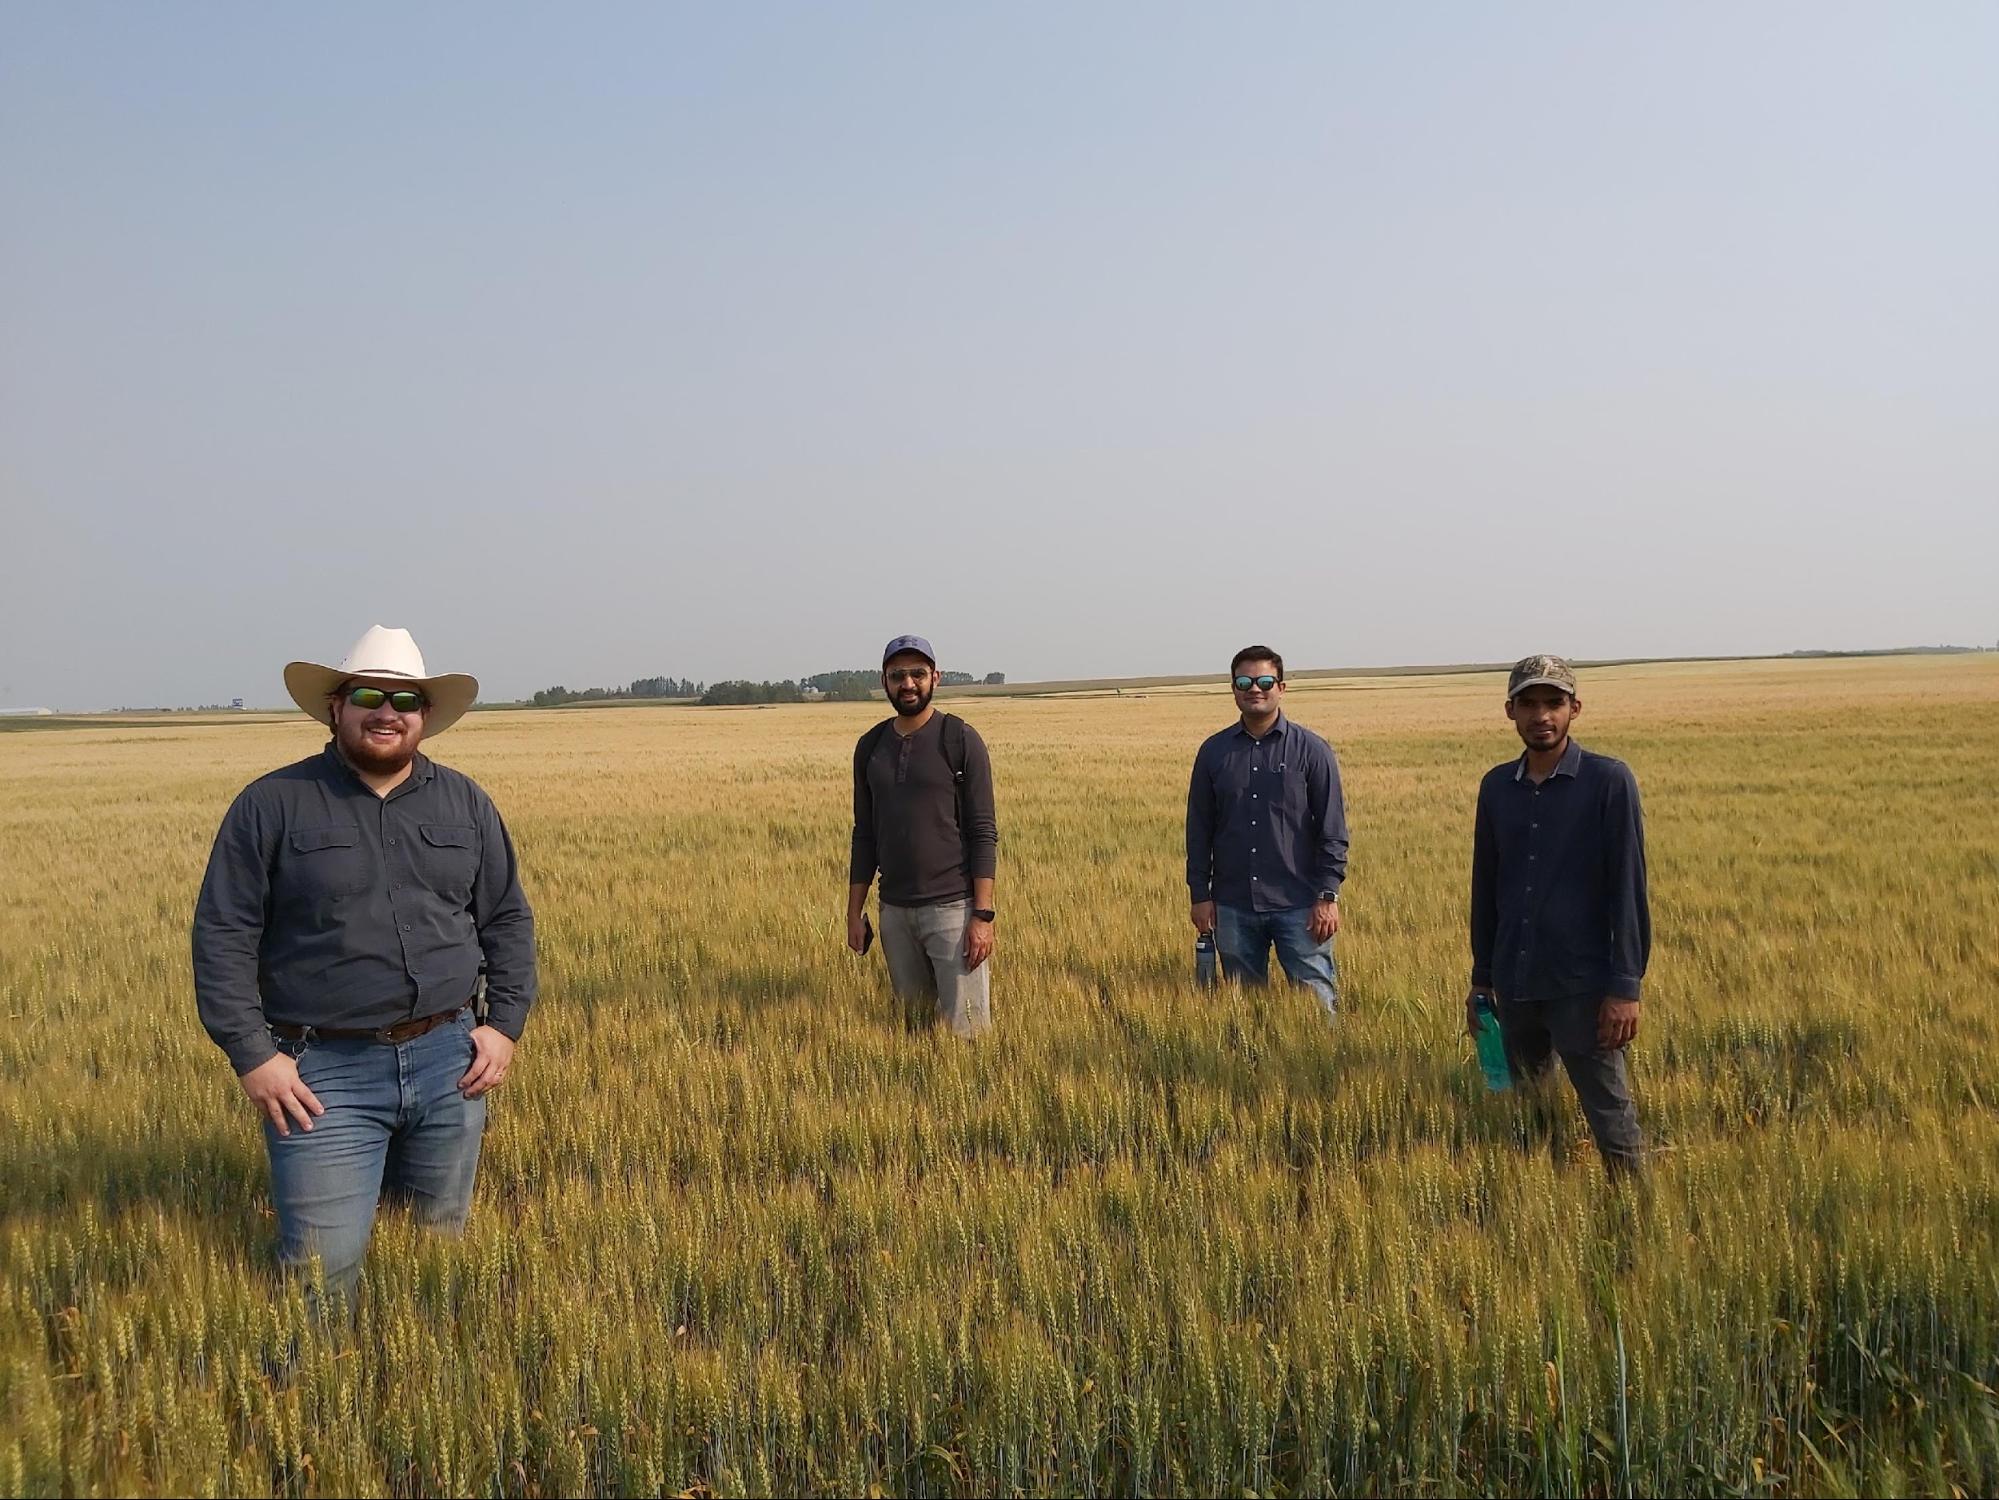
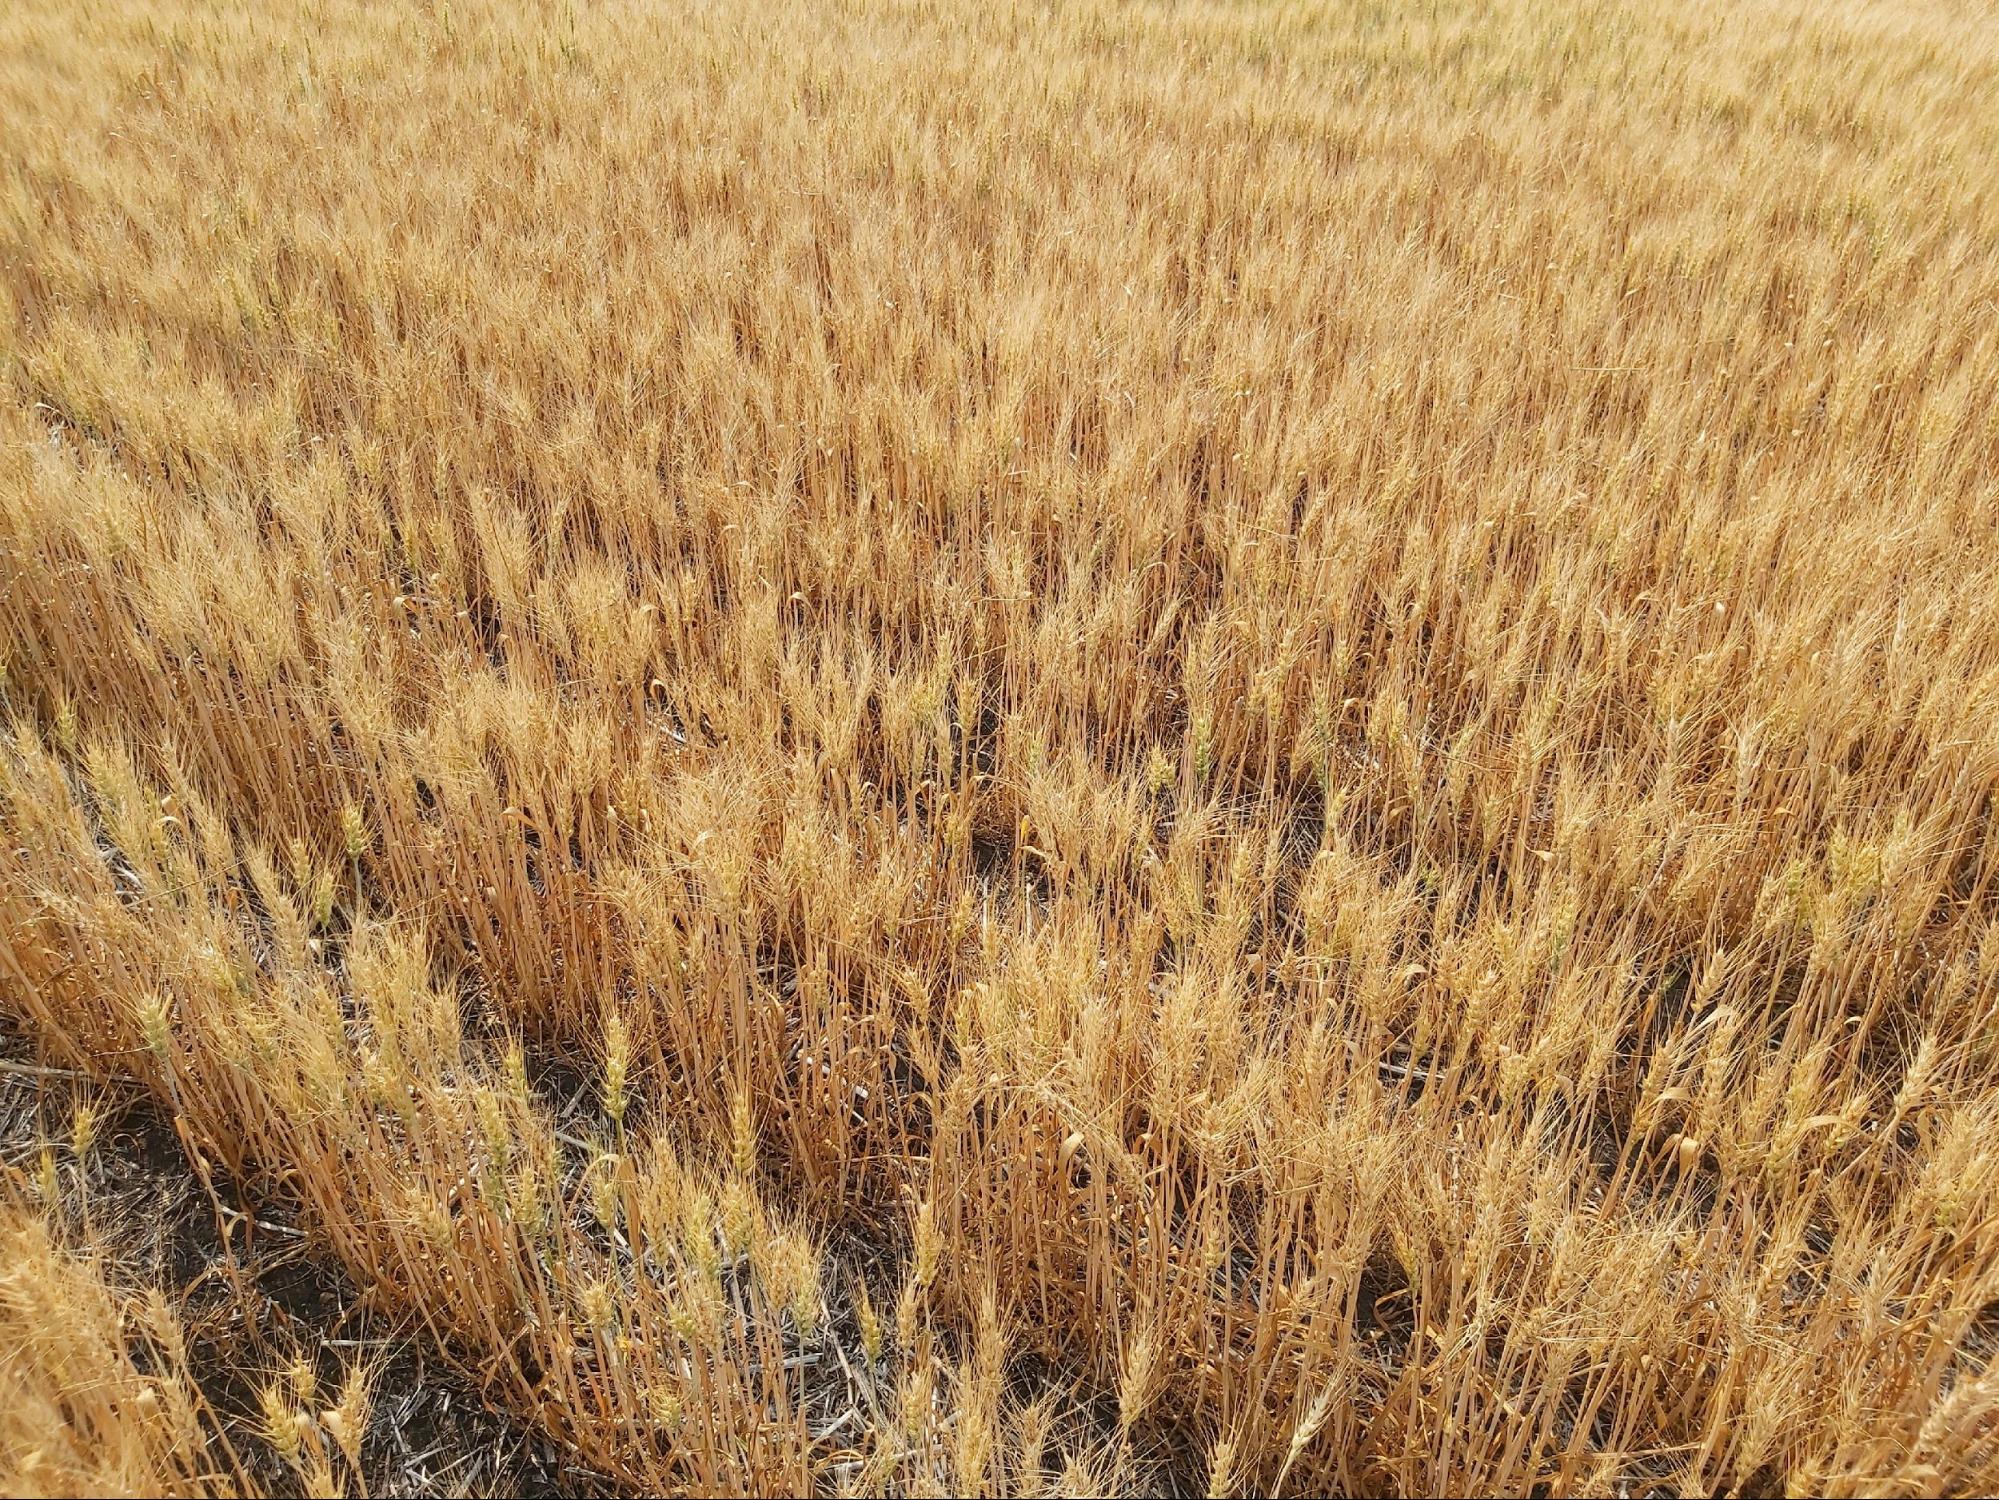
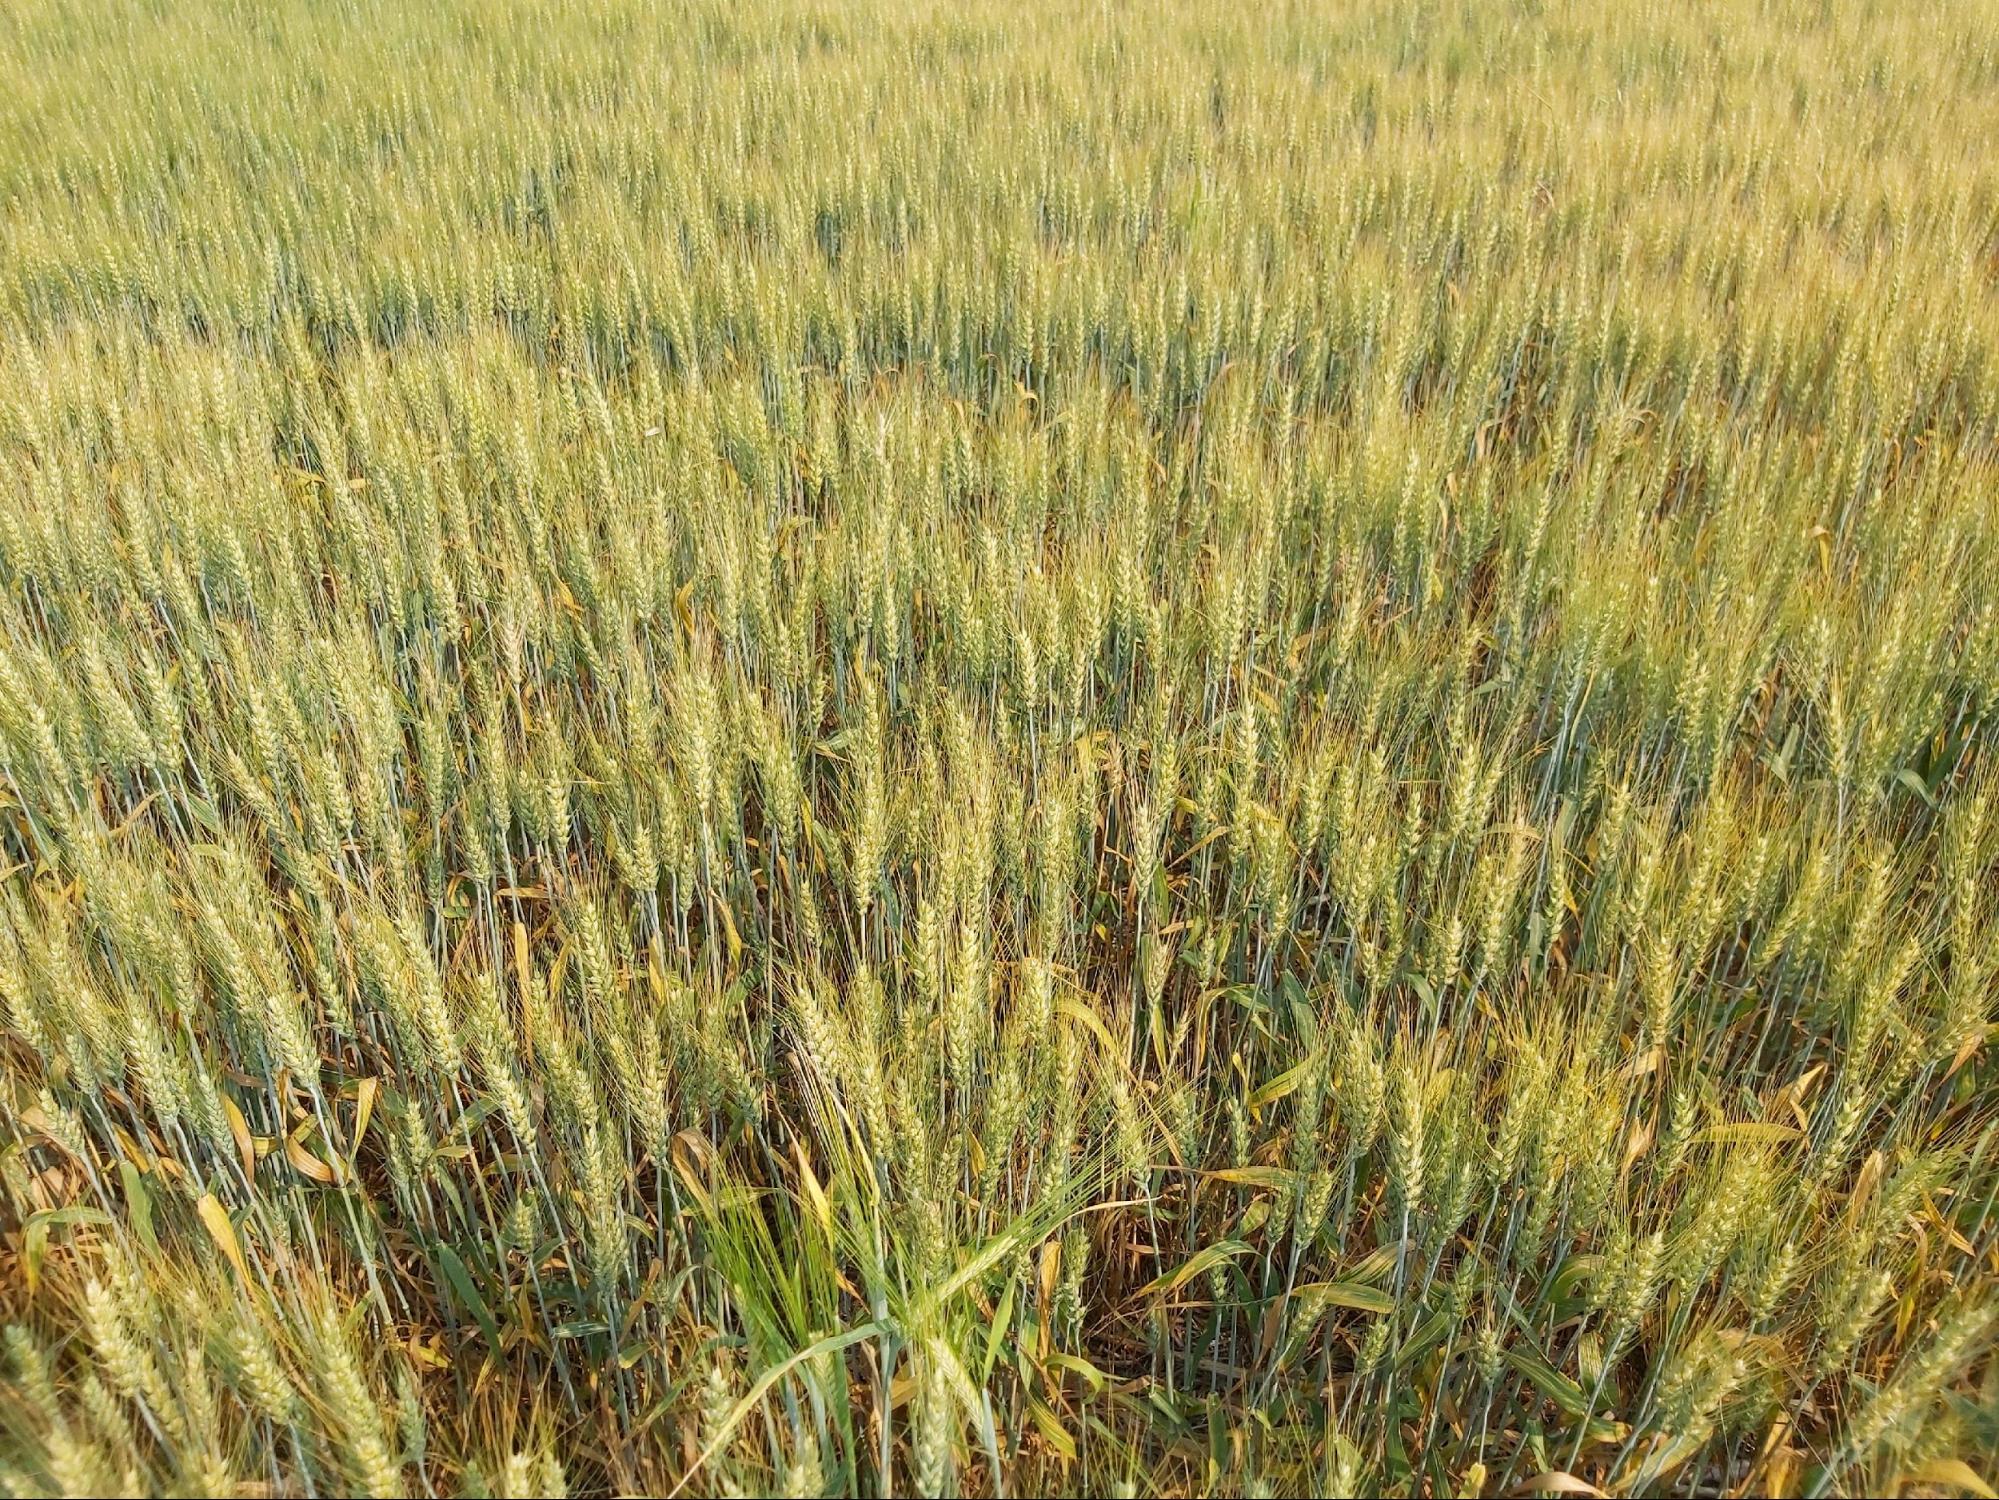
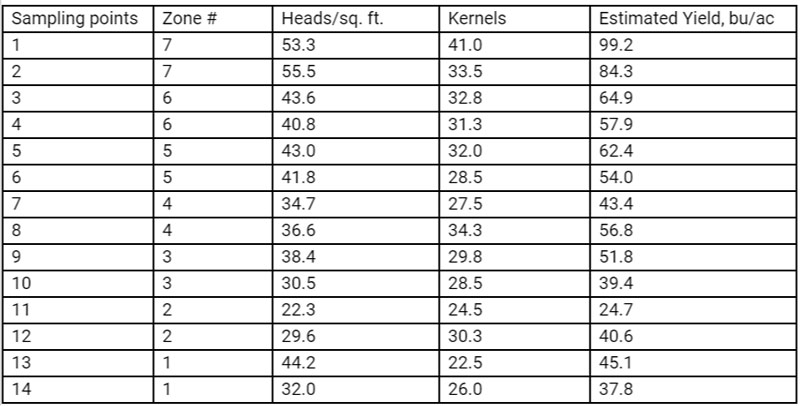
Table. Site-specific yield forecast, Olds College Smart Farm, Field 18.
Knowing the area of each zone, we calculated the average weighted yield for the whole field. Our forecast was 57.3 bu/ac. These results were presented at AgSmart in Olds, AB, on Aug 11, 2021. The field was harvested on September 10, 2021. Yield monitoring data was collected during the harvesting, and after the data cleanup, a yield map was created for the same field (Field 18).
A simple comparison of the maps in Fig. 1 and 5 show their stunning similarity; our analysis of the yield potential variability from the satellite image was very accurate. Calculation of the average actual yield resulted in 56.3 bu/ac versus 57.3 bu/ac forecasted in early August. Taking into account possible yield losses during the harvesting, our forecast results become even more accurate.
These results clearly demonstrate the success of smart farming at Olds College. It also shows a great potential of using digital technologies to increase the efficiency of farming operations and empower Ag specialists with innovative tools for better farm management decisions.
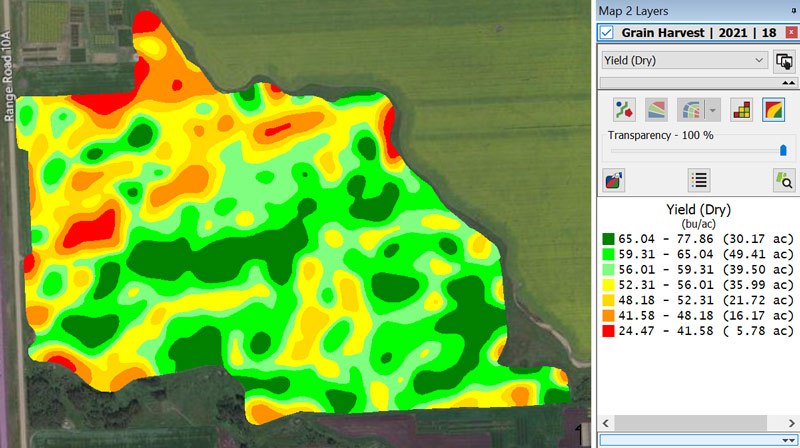
Fig. 5. Yield monitoring map, September 10, 2021. Olds College Smart Farm, Field 18.
By Alex Melnitchouck, Chief Technology Officer, Digital Ag Olds College