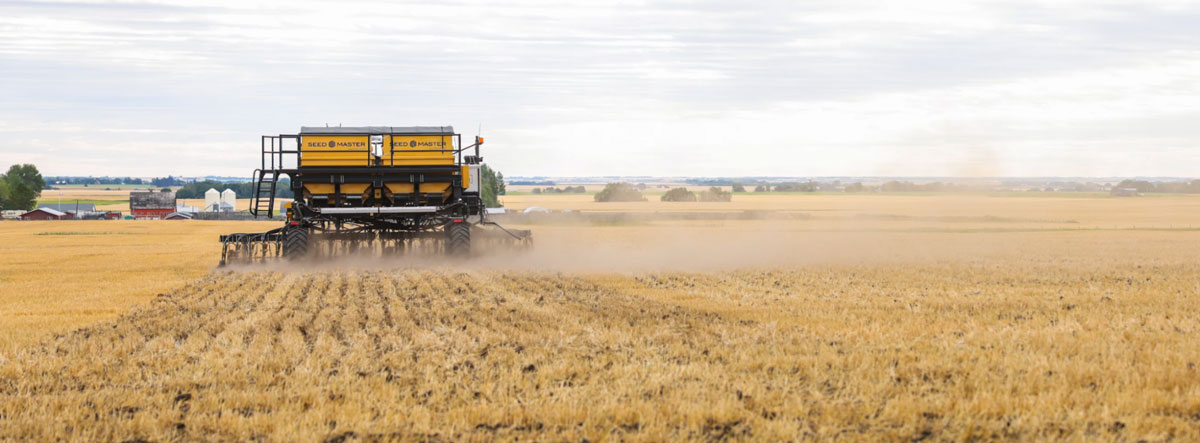
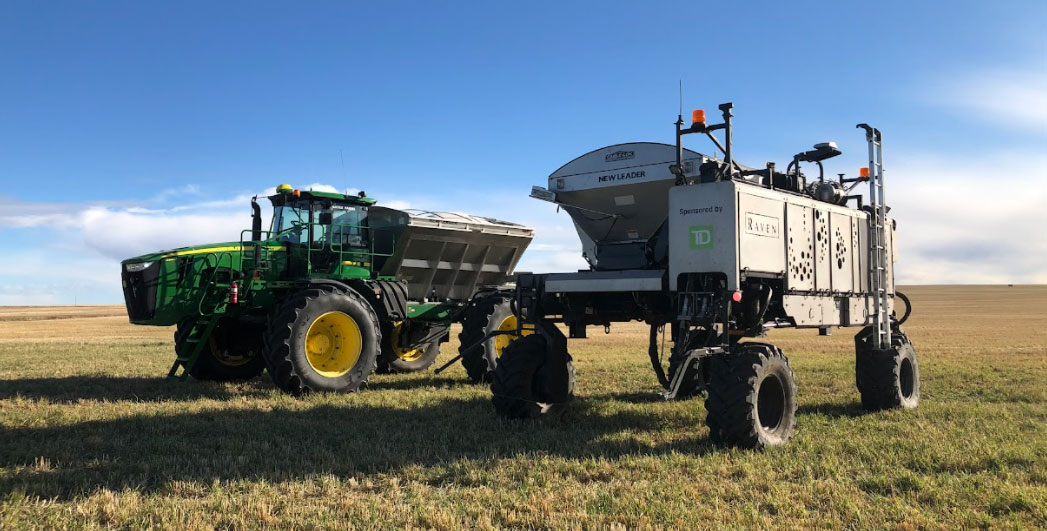
Finishing its second year of using autonomous agriculture equipment, the Olds College Smart Farm was able to get A LOT more comfortable with OMNiPOWER by collecting data on a total of 60 missions seeding, spraying, spreading and training across 5,408 acres in partnership with Carlson Ag, Gatez Farms Ltd. and Pattison Farms.
Olds College Smart Farm made two substantial improvements to OMNiPOWER in the 2021 growing season: a dedicated and expanded team, and increased data capture with new electronic data collection technology. In the second year of operations, based on what Olds College learned about autonomous ag equipment in the first year, the team was able to run the equipment more efficiently, get more acreage coverage, and improve field efficiencies and uninterrupted hands-off operation. And the numbers clearly demonstrate this.
To increase the number of available acres for testing and operation, Olds College partnered with local producers Carlson Ag and Gatez Farms Ltd. to operate OMNiPOWER on a number of their fields located close to campus. As well, the College’s collaboration with Pattison Farms — located in Lemberg, Saskatchewan — allowed Olds College to gather an additional 580 acres of quality user-observed data from four separate missions on Pattison’s OMNiPOWER platform.
Throughout the Olds College Smart Farm and on location at both Carlson Ag and Gatez Farms Ltd., Olds College OMNiPOWER platform completed a total of 56 missions (mission being the term used when OMNiPOWER is carrying out an operation in a field after it has been programmed):
OMNiPOWER also clocked five hours and 16 minutes as the longest hands off operation (beating season one’s record of one hour and 17 minutes).
The team is in the midst of compiling the data collected during the 2021 season about overall performance, learnings and efficiencies from the second year of using autonomous equipment on the Smart Farm, but let’s learn more about the data itself.
The Smart Farm used two methods of data capture for OMNiPOWER this last season:
Observational data is gathered by the team with their own eyes and experiences during each mission. Team members are on site watching OMNiPOWER, making observational notes, and timing the various processes and missions that OMNiPOWER performs in the field.
Somat-eDAQ, an electronic data acquisition device installed on OMNiPOWER, electronically collects location specific data (GPS) and equipment data (CAN bus). This data comes in at a rate of two times a second (yes… twice a second) and includes data such as starts, stops, distance travelled and fuel consumption rates.
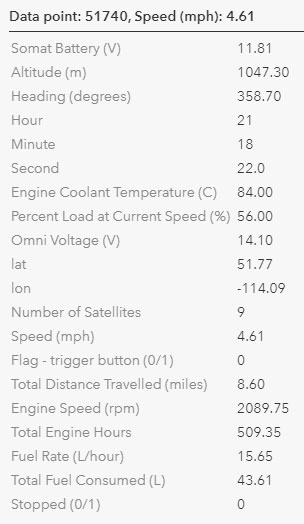
That’s a lot of data acquired from the autonomous platform. Sofia Bahmutsky, Data Scientist for Olds College, has been sifting through the thousands upon thousands of layers of raw data from Somat-eDAQ to do more analysis on OMNiPOWER. This type of electronic data collection translates into a short mission producing approximately 1,000 rows of data and a longer mission (three hours) producing over 49,000 rows of data.
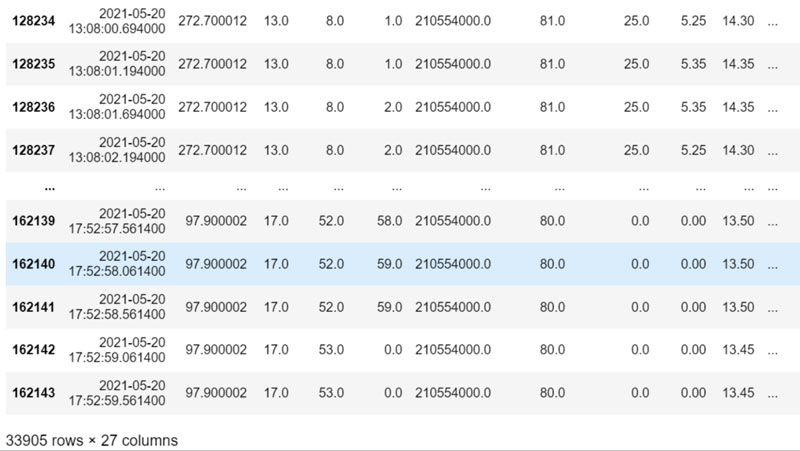
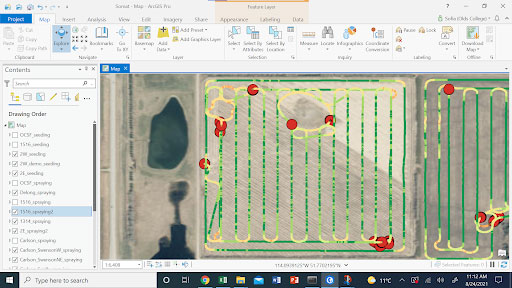
An example of the data downloaded from Somat-eDAQ from a 4.5 hour OMNiPOWER mission that needs to be analyzed which resulted in 33,905 rows of data. This is the type of data Sofia is transforming into a visual representation of an OMNiPOWER mission so it’s understandable to the end user.
The electronic data collected — GPS coordinates, time stamps, amount of fuel used and speed, just to name a few — is data the team can learn from and is more consistent than strictly visual observations. Sofia is transforming the raw data into a visual representation of OMNiPOWER’s work from the entire 2021 growing season in order to make the information understandable for end users and get additional insight on the autonomous platform. From these four variables, Sofia is able to design maps to illustrate the paths OMNiPOWER took, find the speeds and total distance performed during each mission, and calculate potential wasted time from idling, technology issues or breakdowns.
Olds College looks forward to sharing the data collection results from the 2021 OMNiPOWER season soon — and talking about what’s new in autonomous equipment for the next growing season as this three and a half year Smart Farm research project on the benefits and challenges of autonomous agricultural equipment continues.