In the last decade, remote sensing tools became an essential component of precision agriculture. Satellite and aerial imagery is extensively used for field monitoring and crop condition assessment.
The Olds College Smart Farm extensively uses remote sensing in farming operations and research. Recently, we conducted an experiment on comparative usage of imagery from satellites and UAVs with ground sampling for estimation of green biomass yield in two hay fields and two pastures. Knowing the amount of green biomass in the field is very important for farming operations. In the pastures, it is possible to move cattle to certain areas and determine, for how long the animals will have enough food. For silage fields, it is possible to determine the amount of green feed that will be harvested, or calculate the harvested area sufficient to fill up the silage pit, and plan your operations accordingly.
To estimate the total yield of green biomass two sources of multispectral imagery were used:
Sentinel 2B with the spatial resolution of 10 m, and
a multispectral image collected from a drone (eBee SQ) with the resolution of 7 cm.
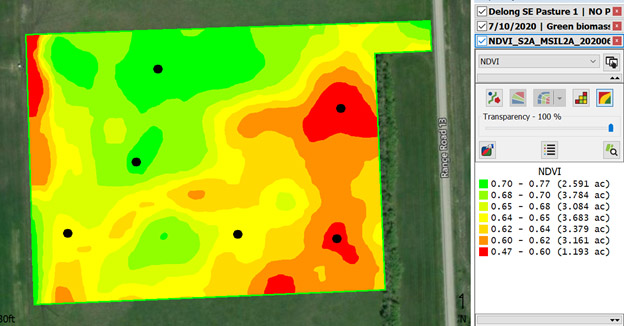
Both images were used to generate Normalize Difference Vegetation Index (NDVI), which was subsequently used to analyze field variability and delineate 5-7 zones with homogenous productivity in each field.
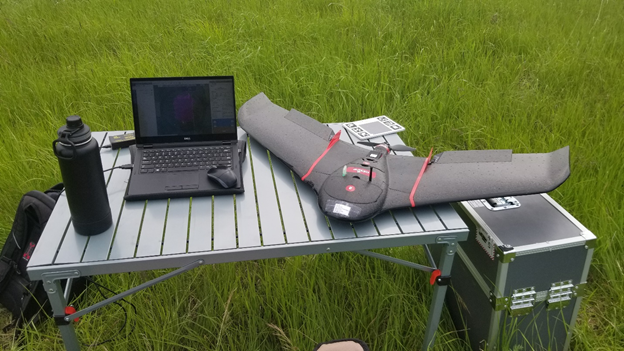
Estimating yield of green biomass using remote sensing tools is a highly scalable and efficient technology. Unfortunately, NDVI does not provide the information about absolute yield – it is just a relative index, which tells us about higher or lower biomass in different parts of the field or pasture. To quantify our maps and convert NDVI values into lbs/acre, six ground samples were collected from each field (Fig. 1). At each sampling location, the grass was cut from 1 sq. m. and weighted. The ground samples were collected from two hay fields and two pastures.
Delong SE Pasture 1, Olds College Smart Farm. Source of imagery: Sentinel 2B, European Space Agency.
Using simple proportion, the weight of samples was used to convert NDVI values to lbs/ac and calculate the total amount of green biomass in the hay fields and pastures. It is important to mention that the conversion factor from NDVI to lbs/ac was different for every field, depending on plant species, soil nutrition levels, soil moisture, and other factors.
| Field | Total area, acres | Total green biomass yield, lbs, based on Sentinel 2B imagery | Total green biomass yield, lbs, based on UAV imagery |
|---|---|---|---|
| 5S | 18.8 | 485,479.40 | 519,715.50 |
| 6 | 54.09 | 1,170,273.80 | 1,192,352.60 |
| Delong Pasture SE1 | 20.9 | 98,605.10 | 102,435.50 |
| Delong Pasture SE2 | 20.5 | 103,768.70 | 102,564.30 |
| Field | Acres | Total actual yield, t | Moisture, % | Actual total dry matter yield, t | Predicted dry matter yield, t (satellite) | Predicted dry matter yield, t (drone) |
|---|---|---|---|---|---|---|
| 5S | 18.83 | 138.98 | 31.00 | 95.89 | 90.08 | 90.49 |
| 6 | 54.09 | 399.22 | 31.00 | 275.46 | 287.96 | 292.42 |
By Dr. Alex Melnitchouck, Chief Technology Officer, Digital Ag, Olds College