Olds College Smart Farm uses a wide range of leading edge technologies which help to solve various problems and make smart farming even more efficient.
The term “satellite imagery” includes a number of different remote sensing technologies. Depending on the goal that needs to be achieved or the problem that needs to be solved, the College uses different imagery products. In addition to the Smart Farm operations, the College uses imagery in academic programs. Students at Olds College learn how to use various types of imagery for a wide range of applications in agriculture.
This type of imagery is available from various sources and, in most cases, it is free for non-commercial and research applications. Imagery aggregators, such as Apple, Google, Microsoft, etc., do not collect imagery themselves – they buy images from satellite imaging companies and make them available to millions of users around the world. Such images are often called “RGB imagery”, because they are taken in Red, Green, and Blue parts of the spectrum. The highest spatial resolution of civic satellites is approximately 30 cm (Maxar Technologies), but through additional algorithms, it can be reduced even to 15 cm.
RGB imagery is used for a wide range of tasks on the Smart Farm, including creation of georeferenced field boundaries, identification of visible problematic areas in the field, mission planning for field machinery, and many other purposes. Unfortunately, commercial usage of high resolution satellite imagery is limited by the high cost of data acquisition. Quite often, the images found on Google or Bing maps were acquired a while ago and, for this reason, they cannot be used for real time field monitoring.
In many cases, digital ag experts need the information beyond the visible part of the spectrum, invisible to a human eye. It is particularly important for monitoring crop health and analyzing crop conditions from space. Typically, multispectral images have between 3 and 12 spectral bands, which cover different parts of electromagnetic spectrum. One of the most important parts of the spectrum is near infra-red (NIR). Healthy plants absorb blue and red light, and they reflect a large portion of green light. For this reason, we are able to see healthy fields being green. However, if our eyes would be able to see the NIR part of the spectrum, healthy fields would look near infra-red to us, because green healthy plants reflect up to 85-90% of the NIR spectrum. By comparing the amounts of the NIR radiation reflected, and the red light absorbed by crop canopy, we can precisely identify places with the highest and lowest crop productivity, delineate management zones, plan field scouting and soil sampling, create prescription maps for variable rate application of fertilizers, crop protection chemicals and seeding, and — in combination with ground truthing data — even forecast yield in every part of the field.
Multispectral imagery is available for free from two main sources: United States Geological Survey (USGS) and European Space Agency (ESA). The Landsat 8 satellite from USGS has spatial resolution of 30 m. It is not sufficient to see small details in the field, such as separate plants, crop rows, or small weed patches, but it is quite enough for delineation of management zones. Sentinel 2, owned by the European Space Agency, has spatial resolution of 10 m, and serves as an excellent tool for crop health monitoring.
In many cases, to answer practical questions about field conditions, digital ag specialists use a combination of spectral bands from imagery, so called “a spectral signature”. The imagery that provided detailed spectral signature for each pixel, and consists of more than 12 spectral bands, is called “hyperspectral”. Hyperspectral datasets typically contain 30 – 500 narrow bands, which can give complete spectral signature for any location and, therefore, provide important insights about the field conditions that might be invisible to a human eye. These insights include different types of crop stress, variability of plant nutrients across the field, etc.
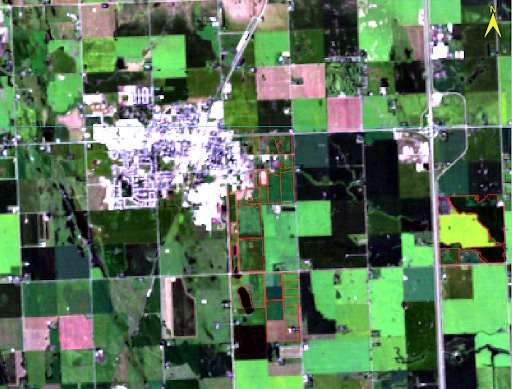
Last year, at the peak of the growing season, we collected a hyperspectral image of the whole Smart Farm from the International Space Station.
Mid-wave infra-red (MWIR) includes the wavelengths between 2500 and 8000 nm. It detects heat; therefore, it is used to detect and map forest fires. MWIR is rarely used in agriculture. Thermal infra-red (TIR) is one of the most interesting parts of the spectrum (8000 – 14000 nm). It is very sensitive to the temperature of objects and can detect even small changes in the surface temperature. The RGB and NIR bands can detect changes in green biomass, when those changes have already occurred (e.g., when the crop is severely damaged by diseases or insects or when the crop is affected by drought or low nutrients in the soil). However, the first characteristic that starts changing immediately after the crop is affected by stress factors is evapotranspiration (loss of water vapor through stomata cells in green leaves). When evapotranspiration slows down in stressed plants, the canopy temperature rises — this can be detected by thermal imaging literally within hours of the onset of crop stress. However, TIR wavelengths have lower energy when compared to RGB or NIR; therefore, it is difficult to collect high-resolution thermal data from satellites. Currently, the best scalable tool for thermal imaging is installed in the Landsat 8 satellite and has a resolution of 100 m. To achieve higher spatial resolution, thermal images for the Smart Farm are collected from aircrafts or drones.
Satellite imagery compliments many other technologies and helps to make efficient agronomic decisions on the farm. The main advantage of satellite imagery is scalability; one satellite image from Landsat 8 or Sentinel 2 satellites can cover the area including more than 40,000 fields. For any of those fields, we can instantly analyze crop conditions, identify areas with higher and lower yield potential, estimate yield of grain and green biomass, plan the application of fertilizers and crop protection products, etc. In most cases, satellite imagery still needs additional ground data, such as soil, tissue testing, etc., to “calibrate” agronomic decisions. Overall, various types of satellite imagery became an integrated part of the Smart Farm activities, and its role is going to grow in the future.
By Dr. Alex Melnitchouck, Chief Technology Officer, Digital Ag, Olds College