Lodging can cause cereal yield losses of 7 to 35% also affecting post-harvest conditions and the quality of the grain (Strydhorst et al., 2018). Therefore, it is important to develop varieties and management practices to reduce the probability of this issue. However, having the tools that allow an accurate lodging assessment, especially at field scale levels, is essential.
For small plots, a standard practice to evaluate lodging is to grade them based on a percentage of the area lodged and the angle of lodging. This usually requires an expert to walk and assess each one of the studied areas. Although a very labour-intensive and time-consuming activity, performing this assessment on plots of a few square meters is still feasible as the area being assessed can easily fit the assessor’s field of view (as exemplified in Figure 1), allowing a trained eye to estimate the lodging.
On the other hand, for on-farm experiments in which plots are usually a few hundred meters long, accurately assessing the percentage of lodging becomes challenging — if not impossible. In this case, the assessor would not be able to see the full length of the plot at once and would have to walk around, identify the lodged areas, and then estimate the percentage of the damaged crop. A cumbersome and subjective estimate.
Luckily, some available technologies can help improve lodging assessment. Unmanned Aerial Vehicles (UAV), commonly known as drones, are one of them. Currently, a basic drone model with a high-resolution camera can be purchased for around CAD$800. Such a device can then be used to fly over the studied area taking pictures, which are later processed into a single high-resolution mosaic that provides an overview of the full extent of the plots allowing a better lodging assessment.
Figure 2 presents an example of an image resulting from this process. Figure 2 was presented by Jeremy Boychyn, Agronomy Research Extension Manager from Alberta Wheat and Barley Commissions to the Digital Ag Team at Olds College of Agriculture & Technology.
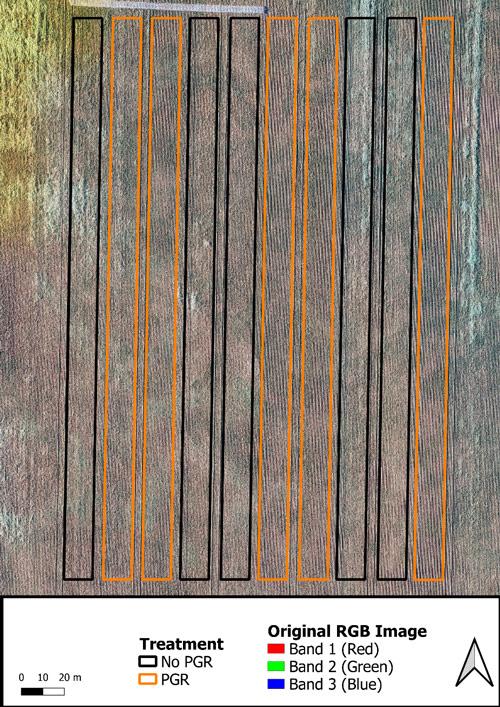 Jeremy explained that this image was taken from a field trial in which the objective was to evaluate the effect of the Plant Growth Regulator (PGR) Manipulator™ 620 (Belchim Crop Protection Canada) on lodging of spring wheat variety AAC Wheatland VB. A visual analysis of this image already indicates that in the areas where PGR was applied less lodging was observed. Also, as for small plots, an estimate of the percentage of the area lodged based on a visual analysis of this image could be obtained. However, Jeremy asked if based on this image it was possible to quantify the lodged areas within each one of the plots.
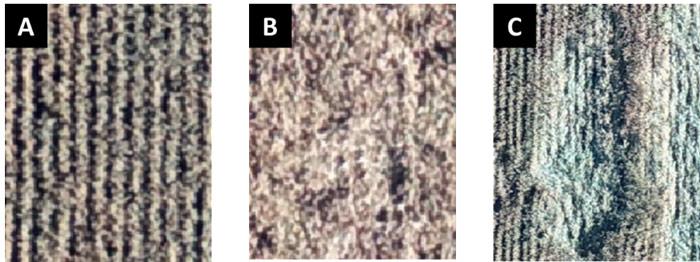
To answer Jeremy’s question and explore the available possibilities, a semi-supervised classification was applied to the provided image. However, since this image only contained the red, green and blue bands, a classical image analysis algorithm known as Gray-Level Co-occurrence Matrix (GLCM), was applied to each one of the original bands. This process increased the number of bands from 3 to 12 and provided information on the texture of the image, which highlighted the areas where the crop was lodged. In sequence, a training dataset was selected from the image. Regions containing standing crop (Figure 3A), minor (lodging was observed but crop not fully lying on the ground – Figure 3B), and major (crop lying on the ground – Figure 3C) lodging were selected throughout the whole image. Then using these regions, a random forest was trained and the model obtained was used to classify the original image into these three classes.
The final results for the classification are presented in Figure 4. In general, the semi-supervised classification algorithm used seemed to classify the lodged areas very well, and differentiate between the minor and major lodging. This is also highlighted by the fact that the PGR-treated plots did present less lodging than the blanks.
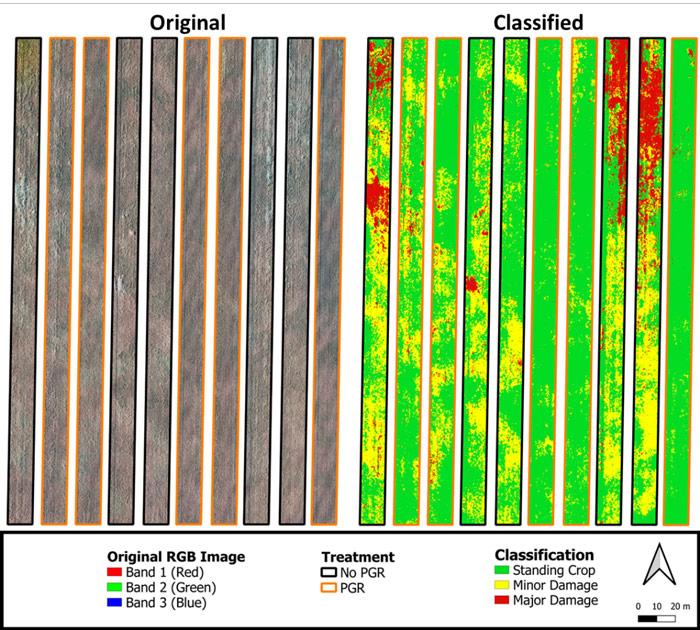 Finally, to fully answer Jeremy’s question and show the full potential of the usage of drones and machine learning in improving the assessment of lodging in cereals, the percentage of the plots covered by each one of the classes was calculated. On average, the non-treated plots had 48.9%, 12.9% and 38.2% of the area covered by standing crop, major damage and minor damage, respectively. While for the plots where PGR was applied 84.9%, 1.2% and 13.9% were standing crop, major damage and minor damage, respectively.
These results demonstrate that using drones and machine learning for lodging assessment presents a good potential and produces quantitative and more objective classification. Although in this case study, this lodging assessment technique was applied to an on-farm field trial, it could also be used for small plots or even for a whole field (e.g. insurance purposes).
Strydhorst, S., Hall, L., & Perrott, L. (2018). Plant growth regulators: What agronomists need to know. Crops & Soils, 51(6), 22–26. https://doi.org/10.2134/cs2018.51.0608
Author: Felippe Karp, PhD candidate from McGill University