Smart farming is not an “easy button”, which can do everything on the farm just by pressing it. It is hard work, where agricultural specialists are empowered by various tools and technologies helping them to be more productive and efficient. Smart Farm uses many analytical tools to improve the efficiency of farming operations. Satellite and drone imagery is a good example of such tools.
Various types of field imagery are used for different purpose. The most common application of remote sensing in agriculture is to analyze crop conditions using a combination of near-infrared (NIR) and red parts of the spectrum. Healthy vegetation absorbs more than 80% of the red light, and it also reflects more than 80% of the near-infrared radiation. By comparing the amount of NIR radiation reflected from crop canopy with the amount of red light absorbed by plants, we can instantly estimate crop conditions in the field. In remote sensing, there is a large number of vegetation indices developed for this particular purpose; the most known indices are Normalized Difference Vegetation Index (NDVI) and Enhanced Vegetation Index (EVI).
All these spectral indices are excellent indicators of field variability. By analyzing satellite, aerial or drone imagery, we can easily identify areas with higher and lower green biomass. Moreover, at the peak of the growing season, vegetation indices are strongly correlated with grain yield. However, there are no vegetation indices that would be able to quantify green biomass or predict grain yield in bu/acre or t/ha. To convert vegetation index to grain yield, we need additional ground truthing data. When we forecast grain yield on a large scale, e.g. country, we can cross-reference historical yield data with the current information. However, for field- or site-specific yield prediction, we need to have detailed information on crops and varieties, moisture conditions, soil fertility, and other factors. Without such data, our field- or site-specific yield forecast can be more than 30-40% off its actual value.
It is difficult to take all those factors into account; in many cases that information is simply unavailable. The easiest way to convert NDVI or EVI into grain yield is to follow the standard agronomic procedure: in certain areas in the field, calculate the number of heads per square meter or square foot, the average number of grains in each head, use 1,000-kernel weight and recalculate these numbers into the grain yield in bushels per acre.
Using this information in different parts of the field, we can correlate these ground measurements with NDVI or EVI and, therefore, transform the NDVI or EVI scale into bushels per acre.
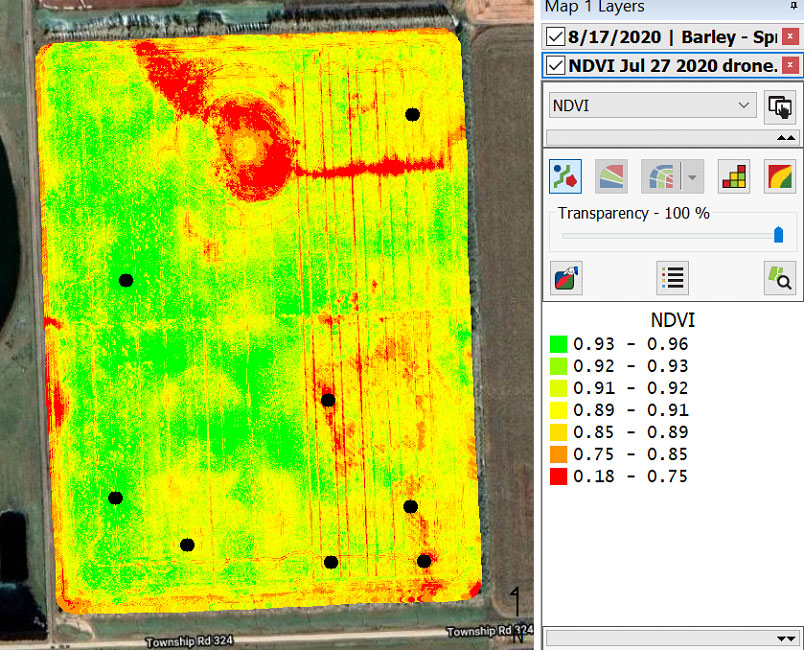
The imagery used for yield forecast can come from satellites or drones. On the Smart Farm, we use both sources. Satellite imagery comes from freely available Landsat 8 or Sentinel 2 satellites; for drone imagery, we used Sensefly eBee SQ fixed wing UAV with a multispectral camera. Typically, collection of drone imagery requires additional efforts. Nevertheless, in this particular case, we used a drone image, because it provided much higher spatial resolution, which was very important for selecting ground sampling locations.
The image was collected on July 27, 2020 – very close to the peak of the growing season. The total field area was 106.61 acre, the crop was spring barley, variety Synergy. Ground sampling was carried out by four agronomy experts in eight locations in the field (Fig. 1). For each location, average yield potential was calculated. These yield assessment results were used to forecast the yield across the field and create a “virtual yield map” (Fig. 2).
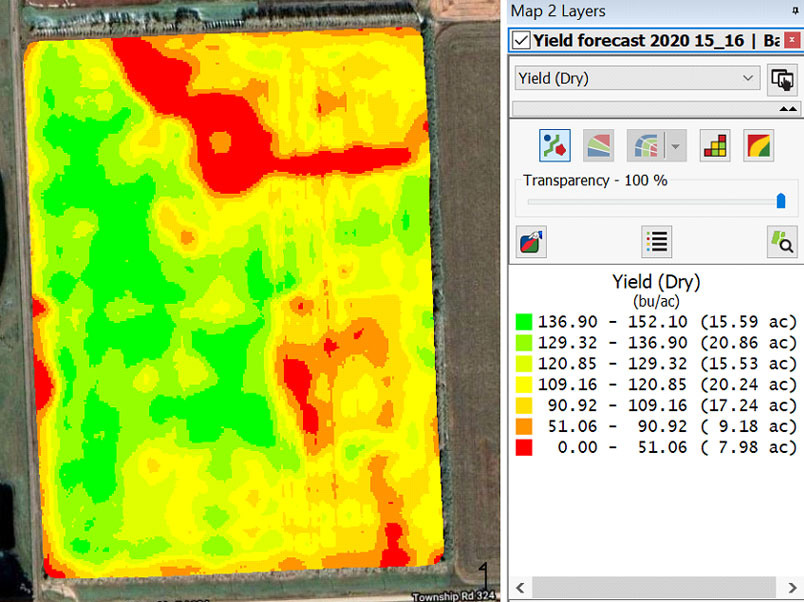
Based on the results of field assessment, yield potential of spring barley in this field varied between 50 and 150 bu/ac, depending on a combination of multiple factors influencing crop development, such as plant available nutrients and moisture in soil, temperature, and other factors. The average forecasted yield was 100.62 bu/ac, and the total yield expected to be harvested from that field was 11,793.2 bu.
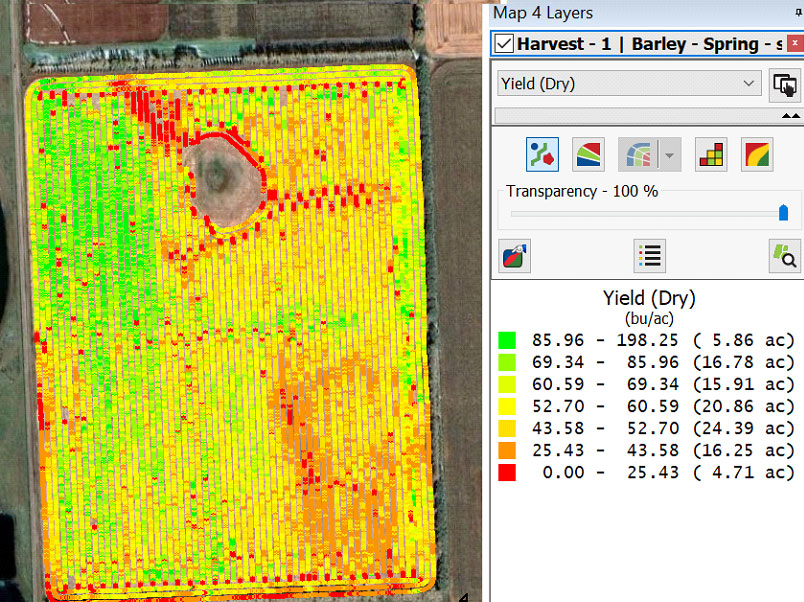
Unfortunately, on Aug 12, the barley crop in this field was significantly damaged by hail, which led to significant yield losses. According to the AFSC assessment, the yield loss in the field was over 50%.
When the field was harvested, a yield map was collected (Fig. 3). According to the yield data, the total yield was 5,893.8 bu, and the yield loss exceeded 50%.
Previously, we used similar methodology to estimate the yield of green biomass in hay fields and pastures. This experiment indicated that imagery from drones and satellites in combination with ground sampling can be successfully used for “virtual yield mapping”.
Written by: Alex Melnitchouck, Ph.D., P.Ag.
Chief Technology Officer, Olds College